4.2 Plotly
One of the easiest ways to make a ggplot plot interactive is with the plotly package (Sievert et al. 2018Sievert, Carson, Chris Parmer, Toby Hocking, Scott Chamberlain, Karthik Ram, Marianne Corvellec, and Pedro Despouy. 2018. Plotly: Create Interactive Web Graphics via ’Plotly.js’. https://CRAN.R-project.org/package=plotly.).
If you went through the “Prerequisites”, you should have installed that package to your
computer. This package has a function, ggplotly, that allows you to make a ggplot
plot interactive with a single line of code.
For example, try it out with the Florida motor vehicle fatality time series from the “Plot”
section.26 To run this code, you should make sure you’ve run the code in the “Plot” section
in your current R session. If the “Environment” pane of your RStudio session includes
“daily_fatalities” in its list, you should be okay. The code itself should look familiar from
the “Plot” section. First, save the plot to an object
called fatality_plot using the gets arrow:
fatality_plot <- ggplot(data = daily_fatalities) +
  geom_line(aes(x = date, y = fatals), color = "darkgray") +
  geom_point(aes(x = date, y = fatals, color = weekday), size = 2) +
  expand_limits(y = 0) +
  scale_color_viridis_d() +
  labs(x = "Date", y = "# of fatalities", color = "Day of week") +
  ggtitle("Motor vehicle fatalities in Florida",
          subtitle = "Late summer / early fall of 2019") +
  theme(legend.position = "bottom")
As a reminder, when you assign a plot object a name, it won’t print out, but you can print it out anytime you want by calling the name you assigned it (Figure 4.1).
fatality_plot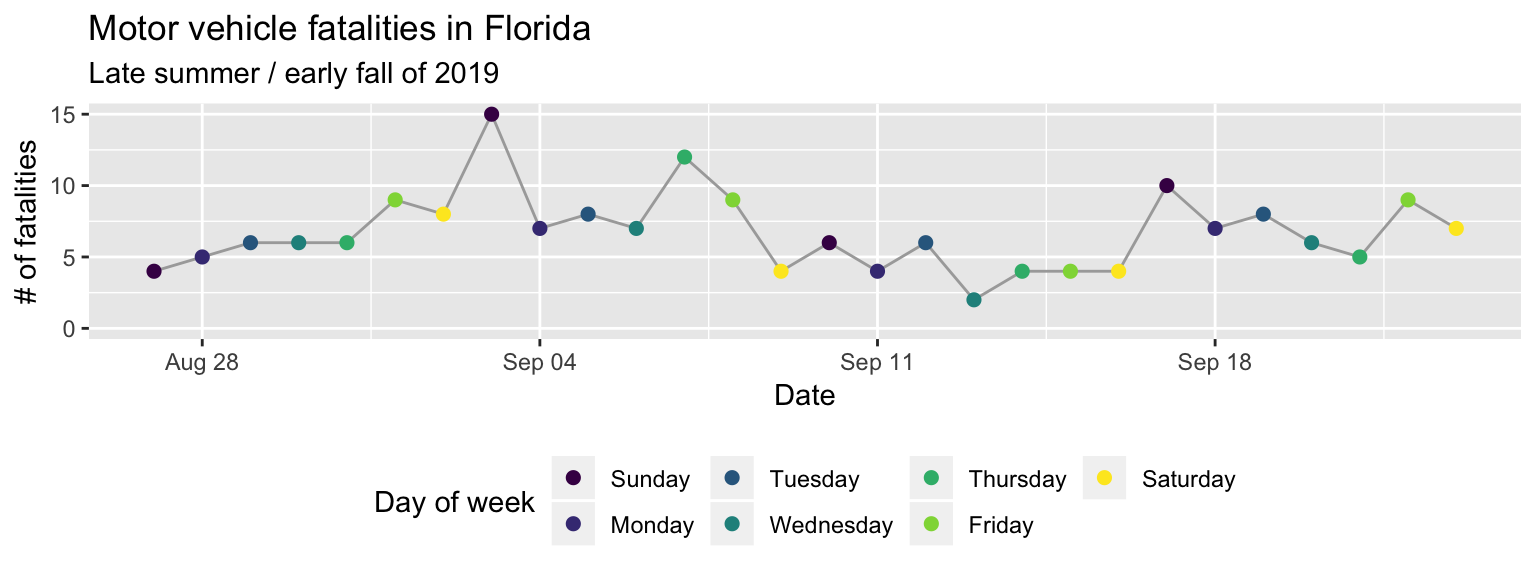
Figure 4.1: Example of printing out a ggplot object by calling its assigned name.
To use plotly to make this plot interactive, all you need to do is load the plotly package and
run this ggplot object
through its ggplotly function:
library("plotly")
fatality_plot %>%
  ggplotly()
Figure 4.2: Example of an interactive plot created with ‘plotly’. Try scrolling over the points and playing around with the buttons in the top right.
Try scrolling over Figure 4.2: when you scroll over a point, a pop-up should appear with some information about the plot. You should also have some buttons on the top right of the plot that allow you to zoom in and out, to download the figure as an image file (png), and to do a few other things.
This is just the tip of the iceburg for what you can do in terms of making interactive plots
in R. I show one more example of a package for creating interactive plots (leaflet, for
creating interactive maps), and the I’ll give you a lot of resources at the end of this
section for where you can find out more about how to make interactive plots using R.