2.3 Saving plots
You can assign the output of a ggplot call to an R object using the gets arrow
(<-), just like you can assign data you’ve read in to an R object. If you do this,
the plot won’t print immediately after you run the code:
irma_fatalities_plot <- ggplot(data = daily_fatalities) +
  geom_col(aes(x = weekday, y = fatals), fill = "skyblue") +
  facet_wrap(~ week_label, ncol = 1) +
  labs(x = "", y = "# of fatalities") +
  theme_classic() +
  ggtitle("Motor vehicle fatalities in Florida by weekday, 2019")
However, now you can print the plot anytime you want by calling the object:
irma_fatalities_plot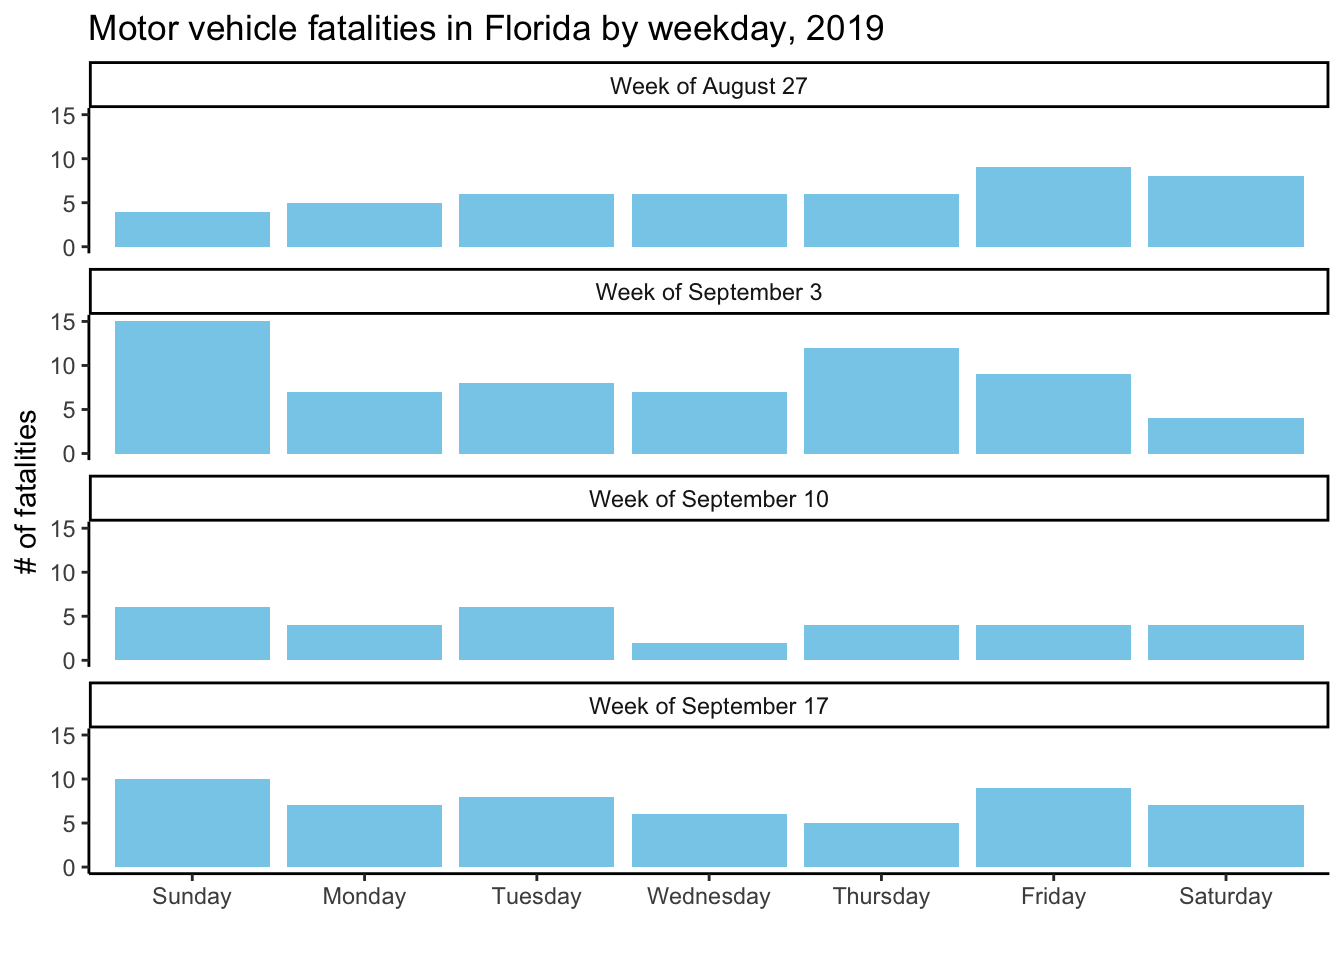
To save this plot to a file, you can use the ggsave function. This function can save
the plot in several different formats (e.g., pdf, jpeg, png, svg). Further, it allows you
to specify the size you’d like for the height and width of the plot as well as the plot
resolution.
The following call will save the irma_fatalities_plot to your working directory,
which should be the R project directory you’re using for the examples if you followed the
set-up in “Prerequisites”. It will save the file as a pdf that is 6 inches tall by 5 inches
wide.
ggsave(irma_fatalities_plot,
       filename = "irma_fatalities.pdf",
       device = "pdf",
       height = 6, width = 5, units = "in")